A Brutal Week Ends With a Fragile Recovery
After a brutal 7 day losing streak that wiped nearly 7% off its value, gold is finally finding its footing.
As of Friday, March 20, 2026, the precious metals market is staging a modest rebound. Gold, which plunged from above $5,300 earlier this month, is now stabilizing in the $4,640 to $4,710 range.
Other metals are also showing signs of life:
- Silver: $71 – $73 per ounce
- Platinum: Near $2,000
- Palladium: Around $1,500
But this rebound is cautious more of a pause than a clear recovery.
What Triggered the Sudden Sell Off ?
At first glance, the drop in gold prices seems counterintuitive.
War and global instability usually push investors toward gold not away from it.
However, this time the market is reacting differently due to a powerful chain reaction.
The Real Driver: Oil, Inflation, and Interest Rates
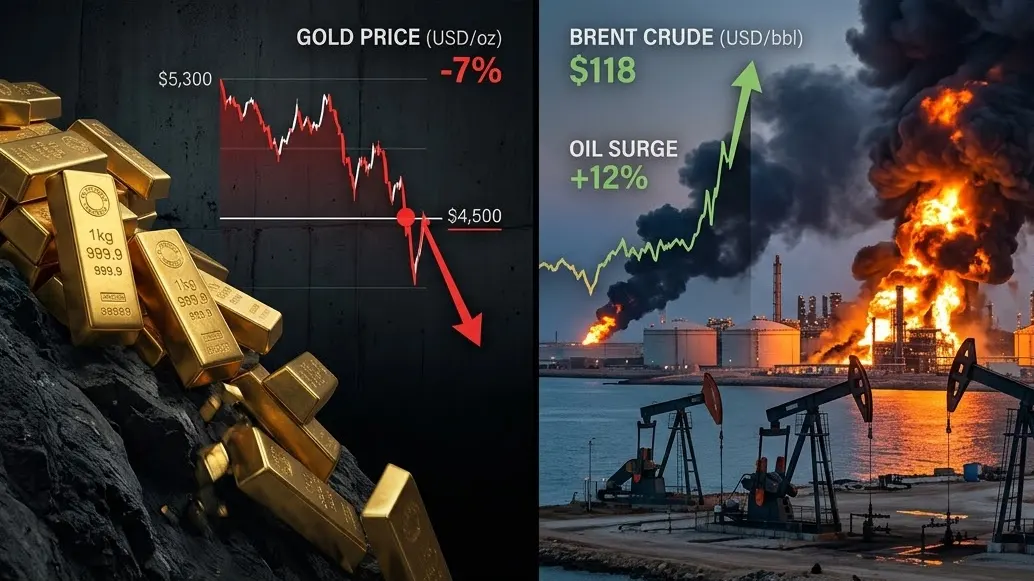
The key story isn’t just rising oil, it’s what rising oil is doing to the broader economy.
Oil prices surged above $115 after strikes on key infrastructure like the Mina Al-Ahmadi refinery and growing threats to the Strait of Hormuz.
This has triggered:
- Rising global inflation fears
- Pressure on central banks to act
Because of this, the U.S. Federal Reserve is now expected to stay aggressive.
Fed Chair Jerome Powell has even hinted at the possibility of another rate hike.
This creates what analysts call a “double whammy” for gold:
- Higher interest rates make bonds more attractive
- A stronger U.S. dollar reduces global demand for gold
Together, these forces are pulling money out of gold markets.
Why Gold Is Struggling Despite the War
Normally, gold thrives during geopolitical crises.
But this time, the nature of the conflict matters.
Because the war is directly impacting energy supply, investors are prioritizing oil over gold.
Instead of flowing into traditional safe havens, capital is moving into:
- Energy markets
- Inflation linked assets
This shift is weakening gold’s usual role as a crisis hedge.
Today’s Bounce: A Technical Rebound, Not a Trend
After days of heavy selling, gold is now ticking higher.
But this is best understood as a “relief rally,” not a confirmed recovery.
From a technical standpoint:
- Gold is now “oversold” on the Relative Strength Index (RSI)
- Traders are stepping in to buy at lower levels
This explains the bounce.
However: The broader trend remains uncertain, and volatility is still high.
The $4,500 Level: The Market’s Line in the Sand
Right now, one number is dominating market attention:
$4,500 per ounce.
This level is critical because:
- It served as a base before gold’s surge to record highs
- It represents a key psychological support
If $4,500 Breaks
This is the bearish scenario.
If current pressures persist high rates, strong dollar, stable oil demand then:
Gold could fall quickly toward the $4,200–$4,350 range.
Such a move would likely trigger:
- Automated selling
- A broader market “liquidation event”
If $4,500 Holds
On the flip side, there is still upside potential.
Gold is technically oversold, which often leads to sharp rebounds.
If geopolitical risks intensify especially:
- A blockade of the Strait of Hormuz
- Wider regional escalation
Then: Gold could rapidly climb back toward $5,000.
Silver’s Wild Ride: Bigger Risks, Bigger Moves
Silver is proving even more volatile than gold.
After breaking above $100 earlier this year, it has now retreated to the $71–$73 range.
This puts it in a fragile position:
- A gold breakdown could drag silver toward $55
- A recovery could push silver higher, faster
Why?
Because silver is both a precious metal and an industrial one.
Its demand is tied to:
- Defense production
- Green energy technologies
This dual role makes silver more reactive to market shifts.
India’s Market: A Surge in Real Demand
While global markets are uncertain, the situation in India tells a different story.
Falling prices are triggering a wave of physical buying.
Current domestic levels:
- 24K Gold: Around ₹1,50,000 – ₹1,55,000 per 10 grams
- Silver: ₹2,40,000 – ₹2,50,000 per kg
The Wedding Season Effect
Because of the recent drop:
Jewelry stores are seeing a sharp increase in foot traffic.
Families are:
- Locking in lower prices
- Buying ahead of the wedding season
This surge in demand is creating a “physical floor” under gold prices.
A Quiet Support System: Central Banks
Beyond retail buyers, another force is helping stabilize gold:
Central banks remain steady buyers.
Despite the recent crash, they continue accumulating gold reserves.
This provides:
- Long term confidence
- A structural price floor around $4,500
Even during sell offs, this demand helps limit downside risk.
Where the Market Goes From Here
Gold is now being pulled in two directions.
On one side:
- High interest rates
- Strong dollar
- Inflation pressures
On the other:
- Geopolitical risks
- Central bank buying
- Physical demand
Whichever force wins will determine the next major move.
A Market at a Breaking Point
Gold is no longer moving on fear alone, it’s reacting to a complex mix of economics and geopolitics.
After a sharp crash, the current rebound offers some relief. But the market remains fragile.
If $4,500 holds, stability may return.
If it breaks, a deeper correction could follow.
At the same time, any escalation in global tensions could quickly reverse the trend.
In short, gold is at a true turning point and the next move could be decisive.